The choice between private and public healthcare systems represents one of the most consequential decisions societies and individuals make. The United States spends at least 40% more per capita on healthcare than any other developed nation, yet ranks middle-of-the-pack on health outcomes, raising fundamental questions about healthcare efficiency and value. Meanwhile, countries like Canada and the United Kingdom provide universal healthcare through primarily public systems, though facing their own challenges with wait times. This comprehensive guide examines both systems’ strengths, weaknesses, and true cost-to-value ratios to help inform the ongoing global debate about optimal healthcare delivery.
Understanding the Two Models
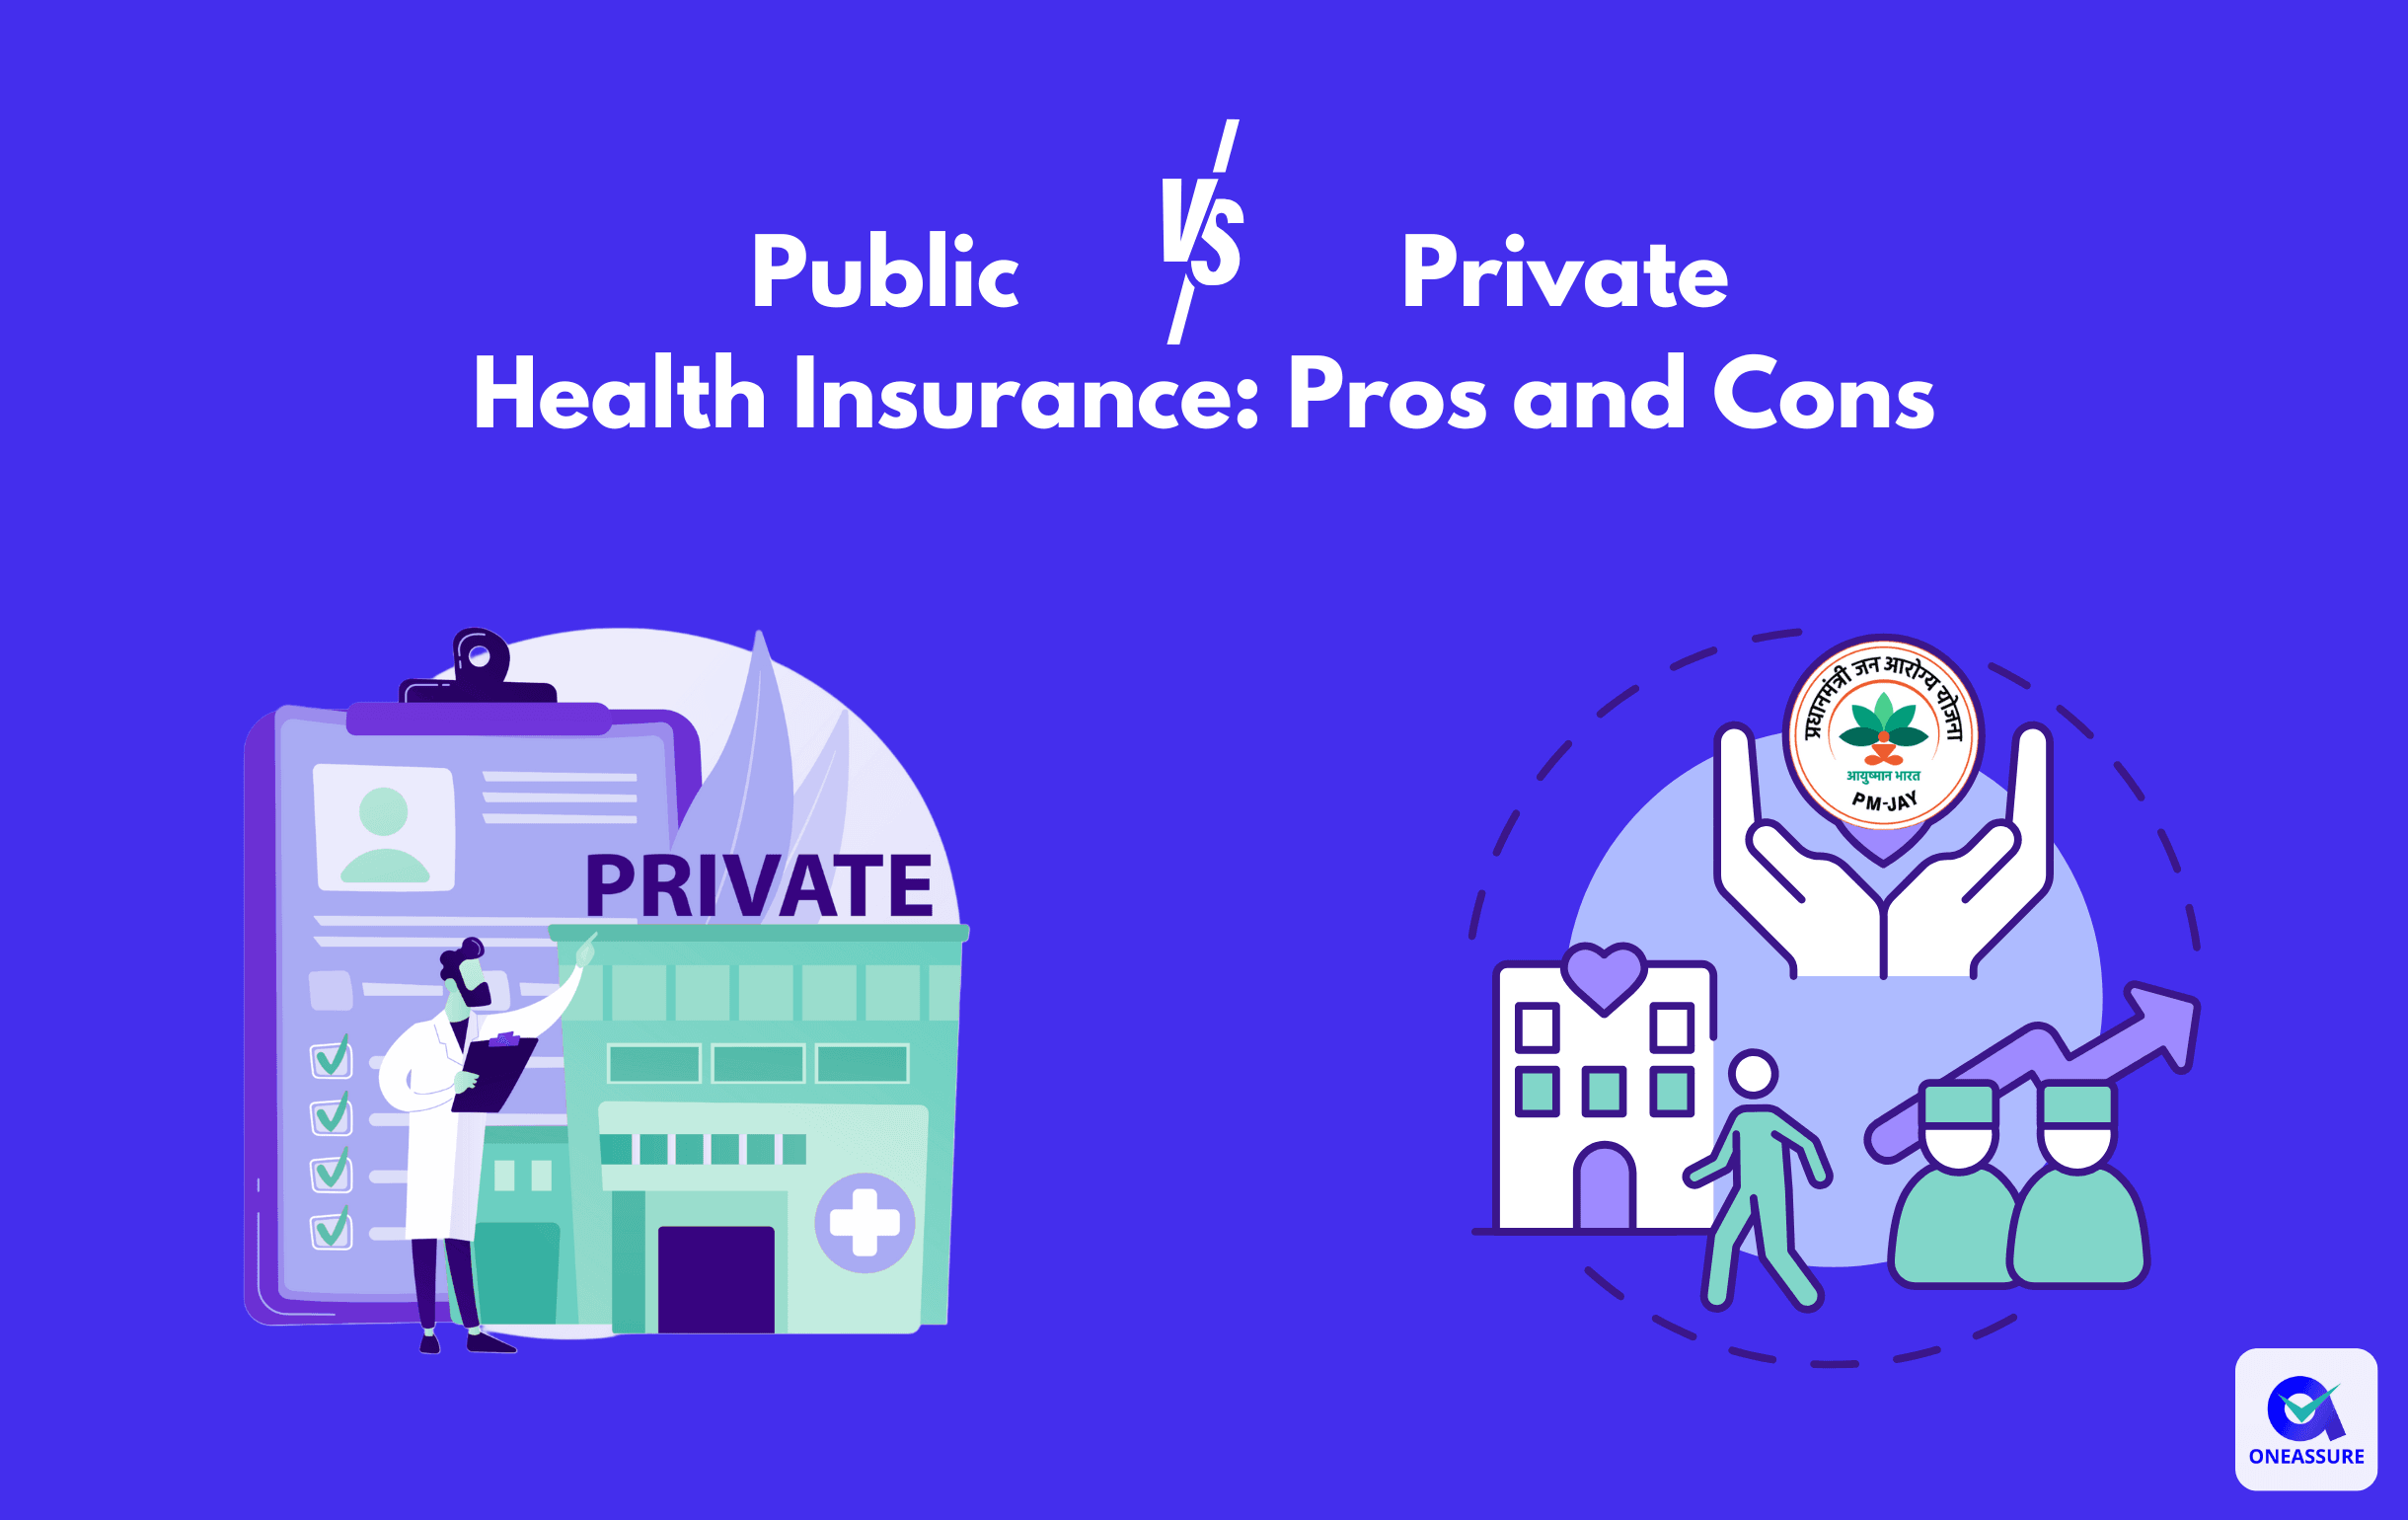
Public Healthcare Systems
Definition and Funding:
Public healthcare systems operate on the principle of universal coverage, typically funded through taxation and government administration. In these systems, healthcare is treated as a public good—a right rather than a commodity.
Common Models:
- Single-payer systems (Canada, UK, Australia): Government is primary payer; most providers are public or contracted
- National health services (UK): Government directly provides most care
- Public insurance with private provider contracting (Thailand, Georgia): Government finances; private sector delivers care
Key Characteristics:
- Equitable access based on need, not ability to pay
- Centralized management and resource allocation
- Typically lower administrative costs
- Free or minimal cost at point of service
- Integrated prevention and treatment
Private Healthcare Systems
Definition and Funding:
Private healthcare relies on individual or employer-sponsored insurance, with for-profit or non-profit providers delivering care. Payment typically occurs through premiums, copays, and deductibles rather than taxation.
Common Models:
- Mixed private insurance (United States): Multiple insurers, mix of employer and individual coverage
- Compulsory private insurance (Germany, Netherlands): Required private insurance with government regulation
- Pure market model (limited globally): Minimal government involvement
Key Characteristics:
- Access depends on financial resources or insurance coverage
- Decentralized, competitive providers
- Higher administrative costs (marketing, profit margins, insurance company overhead)
- Higher costs at point of service
- Patient choice and rapid access emphasized
Cost Comparison: The Value Equation
Healthcare Spending: Dramatic Differences
United States (Mixed Private-Dominant System):
- Total spending: $4.9 trillion (2023), or approximately $14,800 per capita
- Private insurance: 32% ($1.5 trillion)
- Government (Medicare, Medicaid, etc.): 45% ($2.1 trillion)
- Out-of-pocket and other: 23% ($1.1 trillion)
Despite highest spending, outcomes don’t reflect superiority.
Comparison to Other Developed Nations (2022 Data):
- Switzerland: $12,000+ per capita (mixed system)
- Germany: $8,000+ per capita (compulsory insurance)
- France: $7,500+ per capita (mixed public-private)
- Canada: $6,900+ per capita (public)
- UK: $6,300+ per capita (mostly public)
- Australia: $6,200+ per capita (mixed)
The Outcome Paradox:
The United States spends nearly double per capita compared to Canada while achieving comparable or worse health outcomes on most measures—life expectancy, infant mortality, preventable deaths.
Cost-Effectiveness Analysis: Evidence from OECD
2025 Research Across 38 OECD Countries:
A comprehensive 2025 analysis comparing public vs. private healthcare systems across all OECD member nations found:
Strong Evidence for Public System Efficiency:
- No evidence exists supporting the hypothesis that transitioning from public to private systems enhances efficiency
- Strong evidence shows efficiency INCREASES with higher public share of financing
- Public financing produces better healthcare outcomes relative to spending
Key Finding:
While performance improves with higher healthcare budgets overall, moving from public to private systems does NOT improve efficiency—it generally worsens it.
Administrative Costs: The Hidden Burden
Private systems carry dramatically higher administrative overhead:
United States Private Insurance Overhead:
- Insurance company administrative costs: 8% of premiums
- Hospital administrative costs: 25-30% of budgets (vs. 12-15% in public systems)
- Claims processing, billing disputes, authorization denials: Massive administrative burden unique to private systems
Public System Overhead:
- Canada: ~5% administrative costs
- UK: ~3-4% administrative costs
- Savings accrue directly to patient care
Quality and Clinical Outcomes
Treatment Success Rates: The Clinical Evidence
Research Across Low- and Middle-Income Countries (102 Studies):
Public Sector Advantages:
- Tuberculosis: Public sector achieved 85% higher treatment success rates (85% success vs. lower rates in private)
- HIV/AIDS: Higher antiretroviral therapy success in public sector (Botswana study)
- Vaccination rates: Children in public systems received vaccinations at higher rates than those in private care
Why These Differences Exist:
- Public systems follow WHO-recommended treatment protocols
- Private providers often prescribe non-evidence-based regimens
- Financial incentives in private sector encourage unnecessary testing/treatment rather than proven protocols
Private Sector Advantages:
- Better equipment availability and maintenance
- Faster response times to patients
- Superior hospitality and bedside manner
- More comfortable facilities
Critical Finding: Clinical outcomes favor public; patient experience (comfort, wait time) favors private.
Quality Assessment Framework
The World Health Organization defines quality healthcare as having these dimensions:
- Effective: Based on scientific evidence
- Safe: Minimizes harm
- People-centered: Responsive to individual preferences
- Timely: Minimizes waiting
- Equitable: Doesn’t discriminate based on demographics
- Integrated: Coordinates care across settings
- Efficient: Avoids waste
Public systems typically score higher on effectiveness, safety, equity, and integration; private systems score higher on timeliness and people-centeredness.
Wait Times: The Access Trade-off
Public System Wait Times
Canadian Wait Times (2024):
- MRI scans: 12.9 weeks median wait (increased from 10.9 weeks in 2022)
- Other diagnostic imaging: Extended waits for non-urgent procedures
- Cost to patients: $5.2 billion in lost wages from waiting for treatment (2024)
- This works out to $3,364 per person in lost productivity
UK Wait Times:
- Non-urgent consultant-led treatment: Up to 18 weeks
- Emergency care: Timely (urgent services prioritized)
Why These Waits Occur:
- Public systems serve entire populations without financial rationing
- Demand exceeds available resources
- Prioritization based on clinical urgency, not ability to pay
- Chronic underfunding in some countries
Private System Wait Times
United States (Variable by Insurance/Location):
- Specialists: 2-4 weeks average
- Routine appointments: 1 week average
- Emergency care: Often immediate (without triage delays)
- Geographic variation significant
Key Difference:
In private systems, waiting times correlate directly with ability to pay. Wealthy patients can access care immediately; uninsured or underinsured face barriers or delays accessing care at all.
Health Impact of Wait Times
Critical Question: Do wait times harm health outcomes?
Evidence:
- Short waits (weeks) for routine care: Minimal clinical impact
- Extended waits (months) for urgent conditions: Documented harm to health
- Preventable deterioration: Patients’ conditions worsen during extended waits
- But most waits in public systems are for non-urgent care where clinical impact is minimal
Paradox: While wait times in public systems create documented patient frustration and productivity loss, they rarely prevent necessary urgent care. In contrast, financial barriers in private systems prevent care entirely.
Equity and Access: The Fundamental Difference
Coverage and Financial Barriers
Public Systems (Universal Coverage):
- 90-99%+ of population covered
- Medical bankruptcy essentially eliminated
- No cost at point of service (or minimal)
- Access based on clinical need, not financial resources
Private Systems (Varied Coverage):
- United States: ~37 million completely uninsured; 41 million more have inadequate coverage
- Financial barriers prevent necessary care
- Medical debt is #1 cause of personal bankruptcy in U.S.
- 33% of Americans with medical bills report inability to pay for food, heat, or housing
Who Gets Care?
Public Systems:
Services available to all based on clinical need. Research shows up to half the population in some countries uses private options for choice/convenience, but public system ensures universal access.
Private Systems:
Wealthy receive comprehensive care. Middle class may have employer coverage with gaps. Poor and uninsured face significant barriers.
Real-World Outcomes: The Ultimate Measure
Life Expectancy and Mortality
Countries with Public/Universal Systems vs. U.S. (Mixed Private-Dominant):
| Country | System Type | Life Expectancy | Infant Mortality (per 1,000) |
|---|---|---|---|
| Japan | Public/Private mix | 84.6 years | 1.9 |
| Switzerland | Multi-payer (regulated private) | 83.8 years | 3.5 |
| Canada | Public | 82.3 years | 4.6 |
| UK | Public | 81.5 years | 3.8 |
| Australia | Mixed public-private | 83.1 years | 3.0 |
| United States | Private-dominant | 78.9 years | 5.6 |
U.S. Outcomes Despite Highest Spending:
- Life expectancy lower than countries spending 30-50% less
- Infant mortality 2-3x higher than comparable nations
- Preventable deaths: 131,000 COVID-related deaths in 2020 alone could have been prevented with universal coverage
- 68,000 lives and 1.73 million life-years lost annually in current system compared to universal system
Health Outcomes by System Type
Universal Public Systems Show:
- Lower cardiovascular mortality (men in U.S. have 28% higher mortality than Canadians)
- Higher smoking cessation rates
- Lower depression rates
- Higher general sense of wellbeing
Why the Differences?
- Universal access to preventive care
- Early intervention prevents expensive emergency treatment
- Chronic disease management improves with assured access
- Mental health services less stigmatized and more accessible
Hybrid and Emerging Models
The Public-Private Partnership Approach
What Works Globally:
Thailand’s Model (IFC 2025):
- Government funds care through NHSO
- Private providers deliver ~70% of services in Bangkok
- Results:
- Life expectancy increased 7 years (2000-2019)
- Infant mortality fell
- Out-of-pocket costs: 9% of total health spending (lower than comparables)
Georgia’s Model:
- Public financing with 86% private hospital beds
- Results:
- Services expanded to meet needs
- Out-of-pocket costs declining (though still work in progress)
Indonesia’s Model:
- Universal health plan created demand
- Private hospitals grew 9.2% annually post-reform
- New investment and IPOs attracted by government financing
Common Success Factors:
- Government controls payment and ensures minimum quality standards
- Providers (public and private) incentivized through capitation or DRG-based payment
- Data and contract management systems track performance
Lesson: Public financing with private delivery can work effectively—success depends on active oversight, not just privatization.
The Case for Each System
Arguments for Public Healthcare
Strengths:
- Cost-effectiveness: Lower administrative overhead, better outcomes per dollar spent
- Equity: Universal access regardless of income or employment
- Better population health: Preventive focus, chronic disease management
- Stability: Insurance can’t be lost due to employment changes or pre-existing conditions
- Clinical outcomes: Better treatment success for specific conditions (TB, HIV, vaccination)
- Innovation incentives: Focus on health rather than profit maximizes efficiency
Challenges:
- Wait times: Rationing through queues for non-urgent care
- Patient experience: Often described as less hospitable
- Flexibility: Less provider choice
- Innovation: May move slower due to budget constraints
- Political vulnerability: Funding depends on political will, subject to budget cuts
Arguments for Private Healthcare
Strengths:
- Access and timeliness: Shorter wait times for those with insurance
- Choice: More options among providers
- Patient experience: Better hospitality and comfort
- Innovation: Profit incentives drive technological advancement
- Flexibility: Personalized care options
Challenges:
- Cost: Higher per capita spending without equivalent outcome improvements
- Inequity: Access based on wealth, not need
- Inefficiency: Administrative costs 5-8x higher than public systems
- Perverse incentives: Profits through unnecessary testing/treatment rather than prevention
- Coverage instability: Insurance can be lost or have gaps
- Clinical outcomes: Worse treatment success rates for standardized protocols
The Evidence on Value: Which Offers Better Value?
Quantitative Conclusion
Cost per Unit of Health Achieved:
Public and hybrid systems produce better health outcomes at lower per capita cost. This is the consistent finding across research methods and multiple countries.
2025 OECD Finding:
“There is strong evidence that overall efficiency increases with the public share of financing. There is NO evidence supporting the hypothesis that transitioning from public to private systems will enhance efficiency.”
Return on Investment:
Universal public systems could save the United States approximately:
- $450 billion annually (13% of total healthcare spending)
- $105.6 billion during pandemic periods from better coordination
- Enough to fund universal coverage with LESS total spending than current system
Qualitative Conclusion
For Individuals Valuing:
- Guaranteed access regardless of income → Public system
- Rapid access and provider choice → Private system
- Lowest personal risk of bankruptcy → Public system
- Personalized, comfortable experience → Private system
- Best clinical outcomes → Public system
- Fastest appointments → Private system
What Does “Better Value” Mean?
Value = Quality + Access + Equity / Cost
Using this formula:
Public Systems Win On:
- Quality (better clinical outcomes)
- Access (universal coverage)
- Equity (available to all)
- Cost (lower spending)
Private Systems Win On:
- Speed of access (for insured)
- Patient comfort (for insured)
- Provider choice (for insured)
- Technology availability
The Verdict:
Public and hybrid systems with strong public financing offer objectively better value when considering population-level health, cost-effectiveness, and equity. Private systems offer better experience and speed for those with means to access them, but at significantly higher societal cost and without better outcomes.
Recommendations for 2025 and Beyond
For Countries with Fragmented Private Systems
- Implement universal coverage (government financing)
- Allow mixed public-private delivery if desired
- Maintain strong regulation and payment oversight
- Monitor outcomes, not just spending
- Result: Better efficiency and equity at comparable or lower cost
For Countries with Public Systems Facing Wait Times
- Increase funding to match demand
- Implement efficiency improvements
- Introduce private options for those willing to pay (doesn’t harm public access if properly funded)
- Focus on preventing deterioration during waits
- Result: Maintain equity while improving timeliness
For Individuals Choosing Insurance
- In private systems: Prioritize comprehensive coverage to avoid gaps
- Consider: True cost of coverage plus out-of-pocket risks
- Evaluate: Both premium costs and potential financial exposure
- Where possible: Advocate for universal coverage expansion
The Value Question Resolved
The evidence overwhelmingly supports that public and strongly-regulated hybrid systems offer better value than pure private systems—producing superior health outcomes at lower cost with greater equity.
However, value means different things:
- For society: Public systems deliver most health per dollar
- For wealthy individuals: Private systems offer speed and comfort (though at premium cost)
- For vulnerable populations: Public systems are essential for survival
The U.S. experience proves that highest spending doesn’t guarantee best outcomes. Countries achieving universal coverage through public systems spend 30-50% less while achieving better health outcomes.
The optimal global model appears to be strong public financing with regulated public-private delivery, allowing government to control costs and quality while enabling patient choice and provider innovation. Thailand, Georgia, and Indonesia demonstrate this approach produces equity, efficiency, and reasonable access.
For 2025, the question is no longer “public vs. private?” but rather “how can we combine the cost-effectiveness and equity of public financing with the efficiency and patient experience of market competition?”